Lynnville
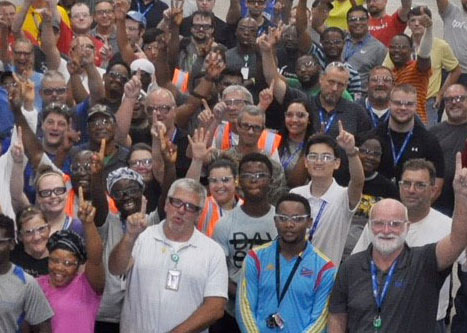
Historic Lynnville, Iowa is located on the winding North Skunk River, 8 miles south of Interstate-80 Exit 179, about an hour east of Des Moines and an hour west of Iowa City. This charming small town is home to friends and neighbors committed to making the community an incredible place to live.
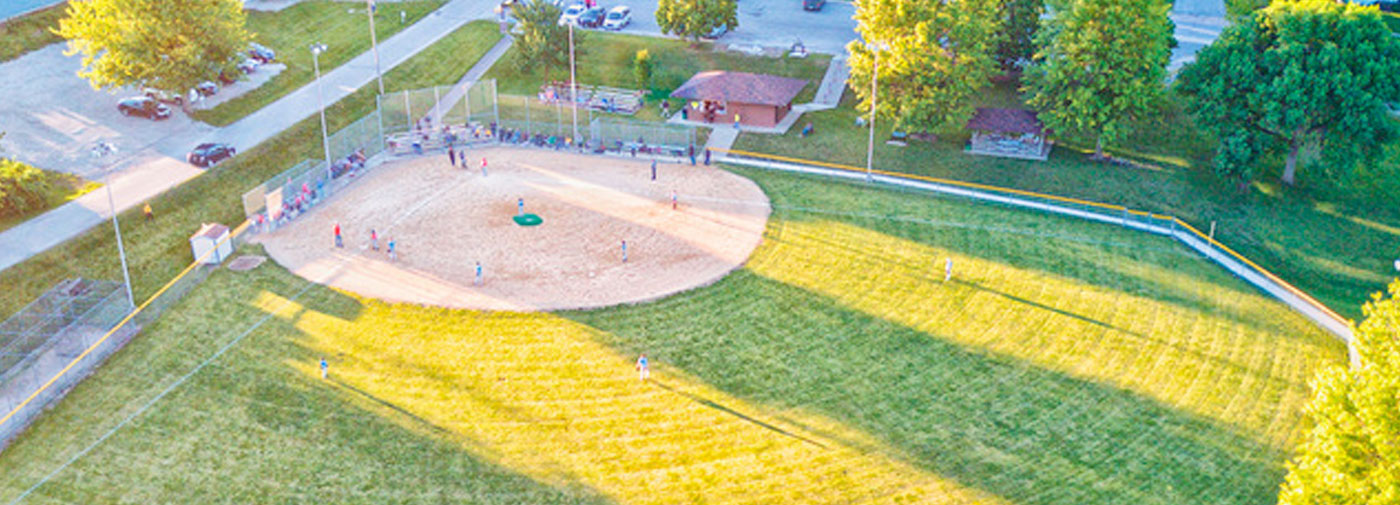
The Diamond Trail Children’s Center & Preschool and the Lynnville-Sully Community School District provide education opportunities in academics, arts, athletics, and more for area youth. In addition, Lynnville has plenty of outdoor activities to keep the family busy, including the Diamond Trail Golf Club, canoe access to the North Skunk River, Big Springs Shooting Complex, and a number of summer community festivals and events.
Population
Population
| Population | 2000 | 2010 | 2025 | 2030 |
|---|---|---|---|---|
| Lynnville | 386 | 379 | 375 | 378 |
Source: ESRI, 2025-08-25
Population by Age
| Population | 2025 |
|---|---|
| 0-4 | 25 |
| 5-9 | 21 |
| 10-14 | 23 |
| 15-19 | 20 |
| 20-24 | 19 |
| 25-29 | 24 |
| 30-34 | 14 |
| 35-39 | 29 |
| 40-44 | 11 |
| 45-49 | 23 |
| 50-54 | 27 |
| 55-59 | 33 |
| 60-64 | 29 |
| 65-69 | 16 |
| 70-74 | 22 |
| 75-79 | 14 |
| 80-84 | 17 |
| 85+ | 8 |
| 18+ | 291 |
| Median Age | 45 |
Source: ESRI, 2025-08-25
Population by Race
| Lynnville | 2025 |
|---|---|
| Total | 375.00 |
| White Alone | 95.73% |
| Black Alone | 0% |
| American Indian Alone | 0% |
| Asian Alone | 0% |
| Pacific Islander Alone | 0% |
| Some Other Race | 0% |
| Two or More Races | 4.27% |
| Hispanic Origin | 2.13% |
| Diversity Index | 12.00 |
Source: ESRI, 2025-08-25
Growth Rate
| Lynnville | 2025 - 2030 |
|---|---|
| Population | 0.16% |
| Households | 0.00% |
| Families | 0.53% |
| Median Household Income | 2% |
| Per Capita Income | 4% |
Source: ESRI, 2025-08-25
Housing
Households
| Population | 2000 | 2010 | 2025 | 2030 |
|---|---|---|---|---|
| Households | 159 | 163 | 156 | 156 |
| Housing Units | 166 | 174 | 165 | 165 |
| Owner Occupied Units | 132 | 128 | ||
| Renter Occupied Units | 24 | 28 | ||
| Vacant Units | 9 | 9 |
Source: ESRI, 2025-08-25
Home Value
| Lynnville | 2025 | 2030 |
|---|---|---|
| Median Home Value | $216,129 | $259,091 |
| Average Home Value | $248,447 | $274,551 |
| <$50,000 | 6 | 6 |
| $50,000 - $99,999 | 18 | 12 |
| $100,000 - $149,999 | 15 | 6 |
| $150,000 - $199,999 | 17 | 8 |
| $200,000 - $249,999 | 31 | 26 |
| $250,000 - $299,999 | 22 | 33 |
| $300,000 - $399,999 | 13 | 30 |
| $400,000 - $499,999 | 3 | 2 |
| $500,000 - $749,999 | 2 | 1 |
| $1,000,000 + | 5 | 4 |
Source: ESRI, 2025-08-25
Housing Year Built
| Year Range | Houses Built |
|---|---|
| 2010 or Later | 10 |
| 2000-2009 | 26 |
| 1990-1999 | 11 |
| 1980-1989 | 26 |
| 1970-1979 | 27 |
| 1960-1969 | 14 |
| 1950-1959 | 14 |
| 1940-1949 | 7 |
| 1939 or Before | 123 |
Source: ESRI, 2025-08-25
Back To TopIncome
Income
| Lynnville | 2025 | 2030 |
|---|---|---|
| Median Household | $76,547 | $84,529 |
| Average Household | $94,358 | $114,239 |
| Per Capita | $39,253 | $47,146 |
Source: ESRI, 2025-08-25
Household Income
| Lynnville | 2025 |
|---|---|
| <$15,000 | 8 |
| $15,000 - $24,999 | 16 |
| $25,000 - $34,999 | 11 |
| $35,000 - $49,999 | 17 |
| $50,000 - $74,999 | 24 |
| $75,000 - $99,999 | 24 |
| $100,000 - $149,999 | 32 |
| $150,000 - $199,999 | 8 |
| $200,000+ | 16 |
Source: ESRI, 2025-08-25
Back To TopEmployees
Commute
| Category | Commuters |
|---|---|
| Workers 16+ | 315 |
| In-County Residents | 127 |
| Out-of-County Residents | 186 |
| Drive Alone | 275 |
| Carpooled | 24 |
| Public Transport | 0 |
| Work at Home | 12 |
| Motorcycle | 0 |
| Bicycle | 0 |
| Walked | 2 |
| Other | 2 |
| Less than 5 minutes | 20 |
| 5-9 minutes | 46 |
| 10-14 minutes | 18 |
| 15-19 minutes | 59 |
| 20-24 minutes | 39 |
| 25-29 minutes | 45 |
| 30-34 minutes | 30 |
| 35-39 minutes | 5 |
| 40-44 minutes | 0 |
| 45-59 minutes | 18 |
| 60-89 minutes | 7 |
| 90+ minutes | 16 |
| Average Travel Time | 0 |
Source: ESRI, 2025-08-25
Source: ESRI, 2025-08-25
Employees by NAICS
| Category | Number |
|---|---|
| Total Employees | 139 |
| Agr/Forestry/Fish/Hunt | 0 |
| Mining | 0 |
| Utilities | 0 |
| Construction | 14 |
| Manufacturing | 3 |
| Wholesale Trade | 4 |
| Retail Trade | 23 |
| Motor Veh/Parts Dealers | 0 |
| Furn & Home Furnish Str | 0 |
| Electronics & Appl Store | 0 |
| Bldg Matl/Garden Equip | 0 |
| Food & Beverage Stores | 12 |
| Health/Pers Care Stores | 0 |
| Gasoline Stations | 9 |
| Clothing/Accessory Store | 0 |
| Sports/Hobby/Book/Music | 2 |
| General Merchandise Str | 0 |
| Transportation/Warehouse | 4 |
| Information | 4 |
| Finance & Insurance | 15 |
| Cntrl Bank/Crdt Intrmdtn | 11 |
| Sec/Cmdty Cntrct/Oth Inv | 2 |
| Insur/Funds/Trusts/Other | 2 |
| Real Estate/Rent/Leasing | 0 |
| Prof/Scientific/Tech Srv | 2 |
| Legal Services | 0 |
| Mgmt of Comp/Enterprises | 3 |
| Admin/Support/Waste Mgmt | 0 |
| Educational Services | 0 |
| HealthCare/Social Assist | 0 |
| Arts/Entertainment/Rec | 11 |
| Accommodation/Food Srvcs | 22 |
| Accommodation | 20 |
| Food Srv/Drinking Places | 2 |
| Other Srv excl Pub Admin | 14 |
| Auto Repair/Maintenance | 1 |
| Public Administration Emp | 20 |
Source: ESRI, 2025-08-25
Educational Attainment (25+)
| Lynnville | 2025 |
|---|---|
| <9th Grade | 6 |
| Some High School | 3 |
| GED | 15 |
| Graduated High School | 136 |
| Some College/No Degree | 30 |
| Associates Degree | 28 |
| Bachelor's Degree | 45 |
| Graduate Degree | 4 |
Source: ESRI, 2025-08-25
Back To TopBusinesses
Businesses by NAICS
| Category | Number |
|---|---|
| Total Businesses | 32 |
| Agr/Forestry/Fish/Hunt Bus | 0 |
| Mining Bus | 0 |
| Utilities Bus | 0 |
| Construction Bus | 4 |
| Manufacturing Bus | 1 |
| Wholesale Trade Bus | 1 |
| Retail Trade Bus | 3 |
| Motor Veh/Parts Dealers Bus | 0 |
| Furn & Home Furnish Str Bus | 0 |
| Electronics & Appl Store Bus | 0 |
| Bldg Matl/Garden Equip Bus | 0 |
| Food & Beverage Stores Bus | 1 |
| Health/Pers Care Stores Bus | 0 |
| Gasoline Stations Bus | 1 |
| Clothing/Accessory Store Bus | 0 |
| Sports/Hobby/Book/Music Bus | 1 |
| General Merchandise Str Bus | 0 |
| Transportation/Warehouse Bus | 1 |
| Information Bus | 2 |
| Finance & Insurance Bus | 3 |
| Cntrl Bank/Crdt Intrmdtn Bus | 1 |
| Sec/Cmdty Cntrct/Oth Inv Bus | 1 |
| Insur/Funds/Trusts/Other Bus | 1 |
| Real Estate/Rent/Leasing Bus | 0 |
| Prof/Scientific/Tech Srv Bus | 1 |
| Legal Services Bus | 0 |
| Mgmt of Comp/Enterprises Bus | 1 |
| Admin/Support/Waste Mgmt Bus | 0 |
| Educational Services Bus | 0 |
| HealthCare/Social Assist Bus | 0 |
| Arts/Entertainment/Rec Bus | 3 |
| Accommodation/Food Srvcs Bus | 3 |
| Accommodation Bus | 2 |
| Food Srv/Drinking Places Bus | 1 |
| Other Srv excl Pub Admin Bus | 6 |
| Auto Repair/Maintenance Bus | 1 |
| Public Administration Bus | 2 |
Source: ESRI, 2025-08-25
Back To Top